In order to more effectively engage with communities to make low-carbon choices, the CoolClimate Network team created a carbon footprint calculator as a benchmarking tool for households and businesses. Using a combination of publicly available data and extensive data collected through outreach, the team developed a tool to help communicate this data. I created a UI which would help lead our users through a data-driven experience and engage them in actionable next steps.
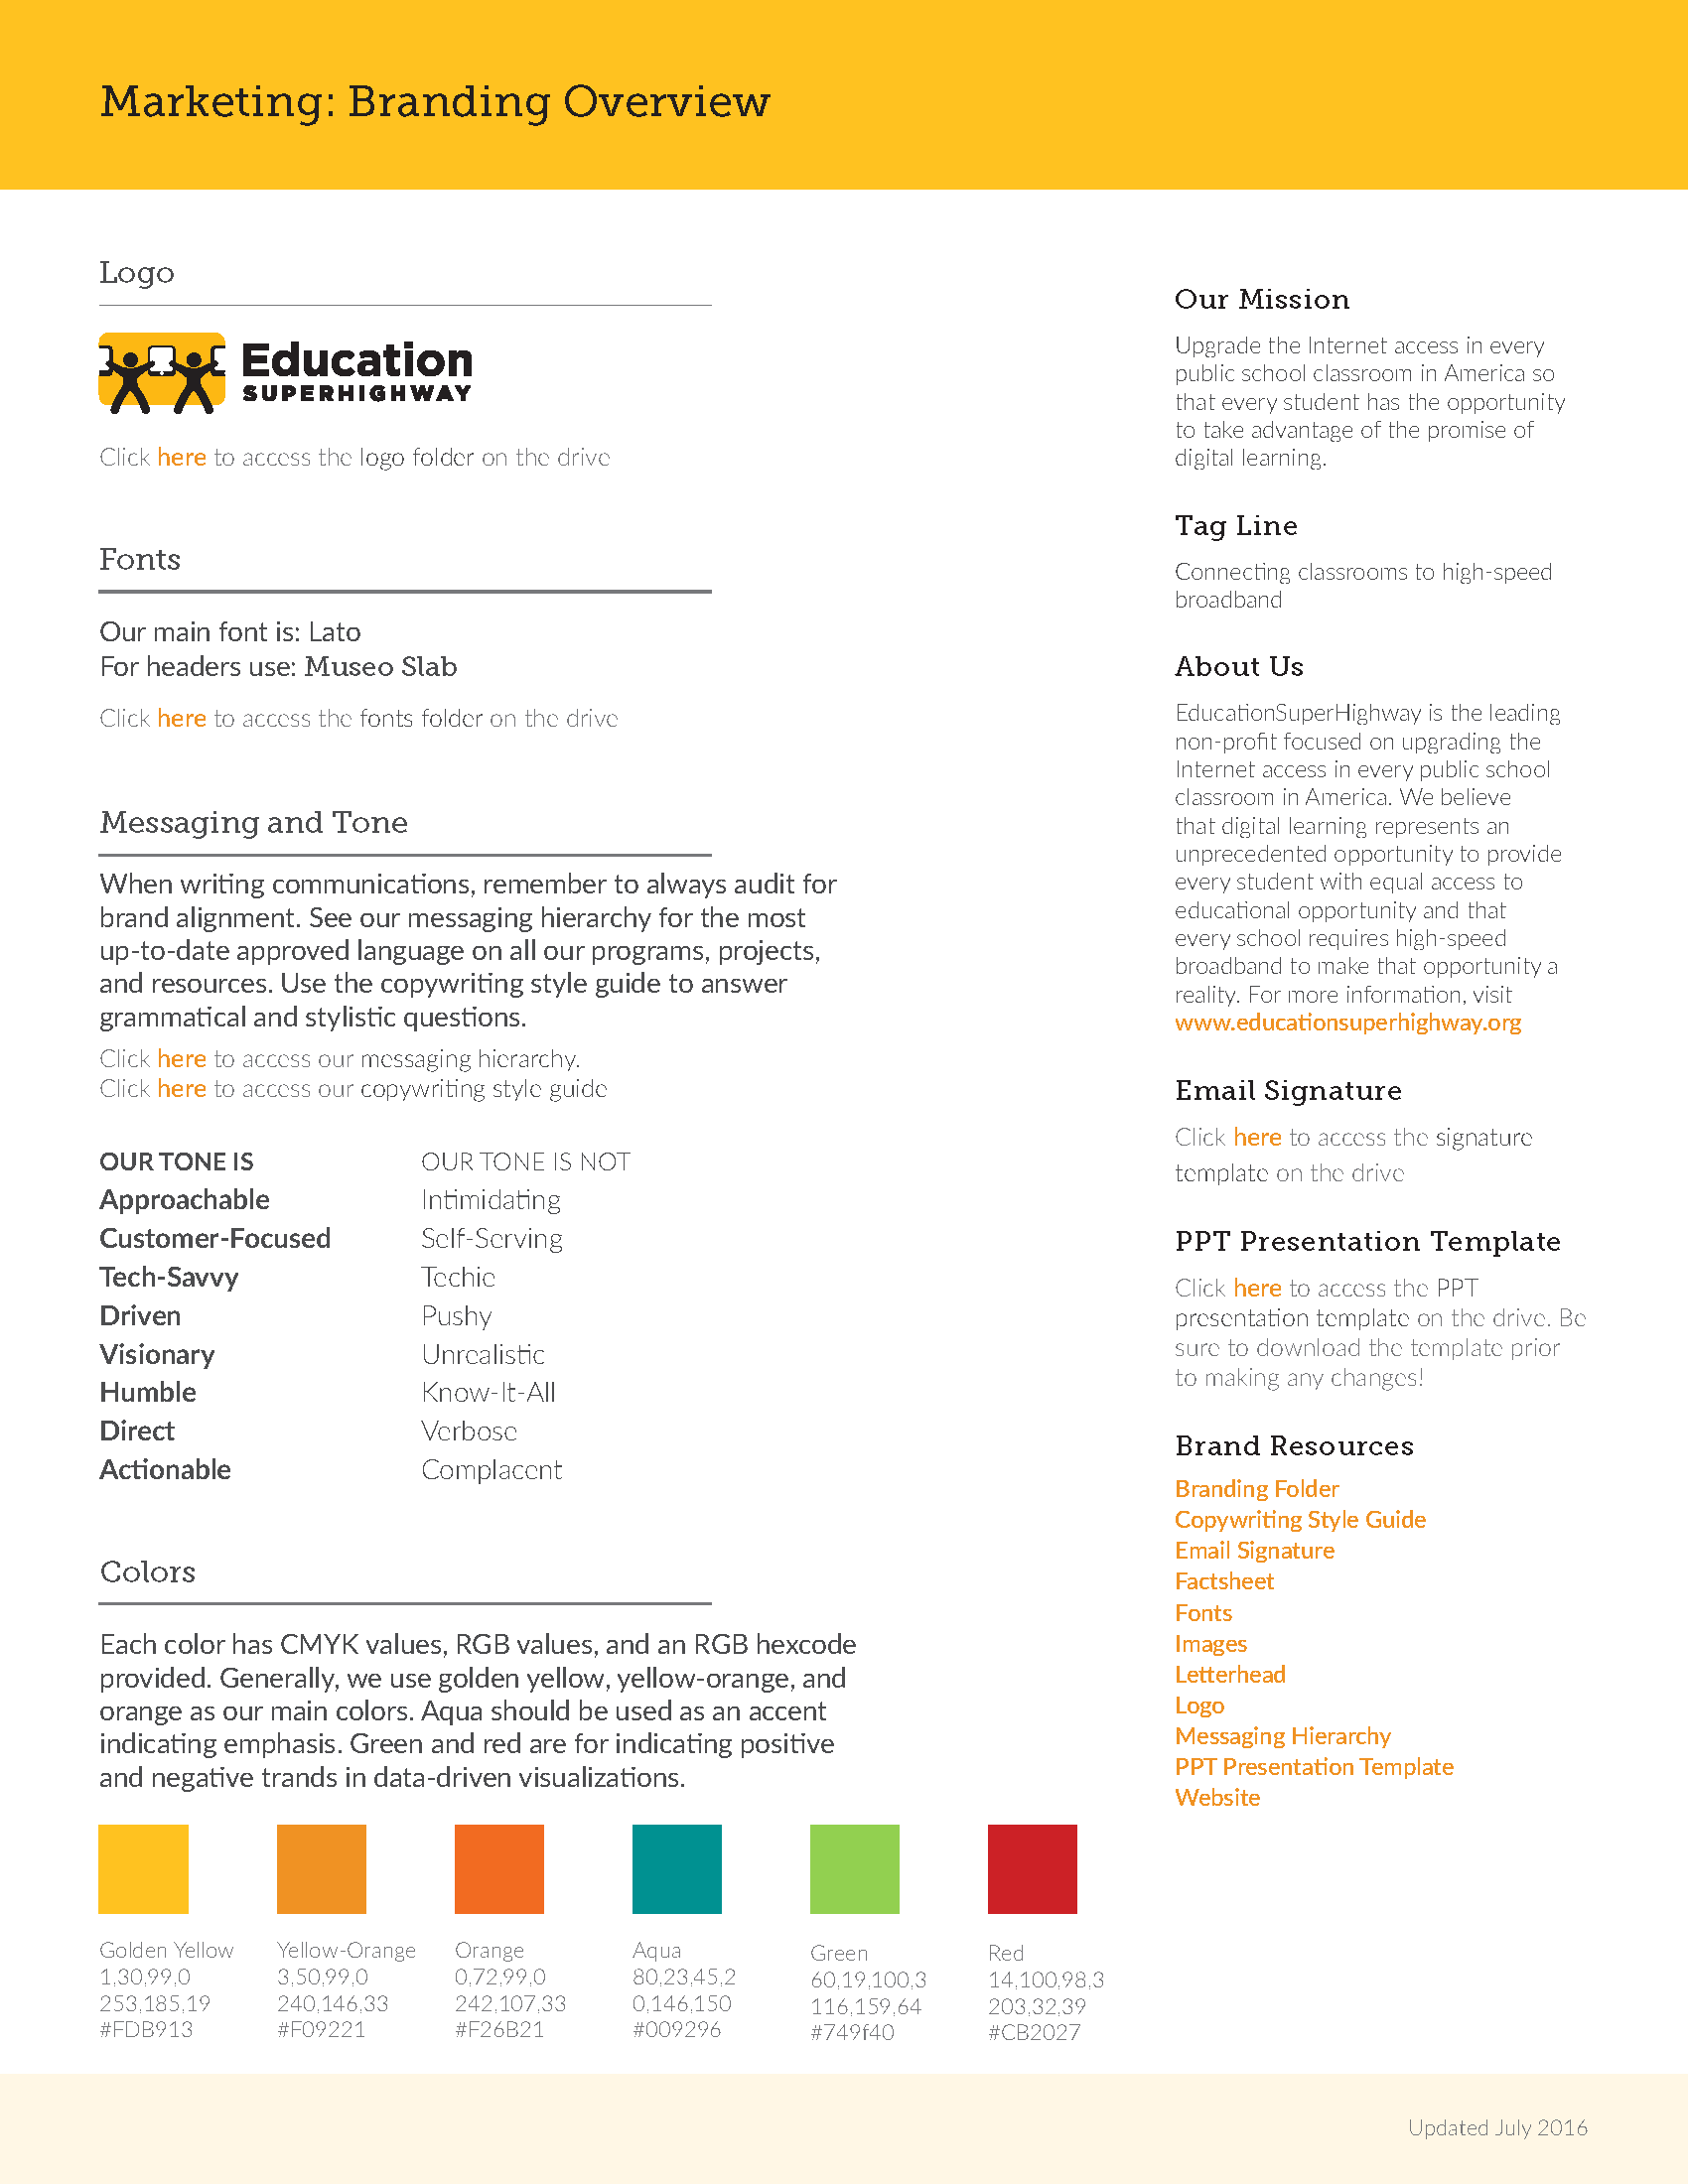
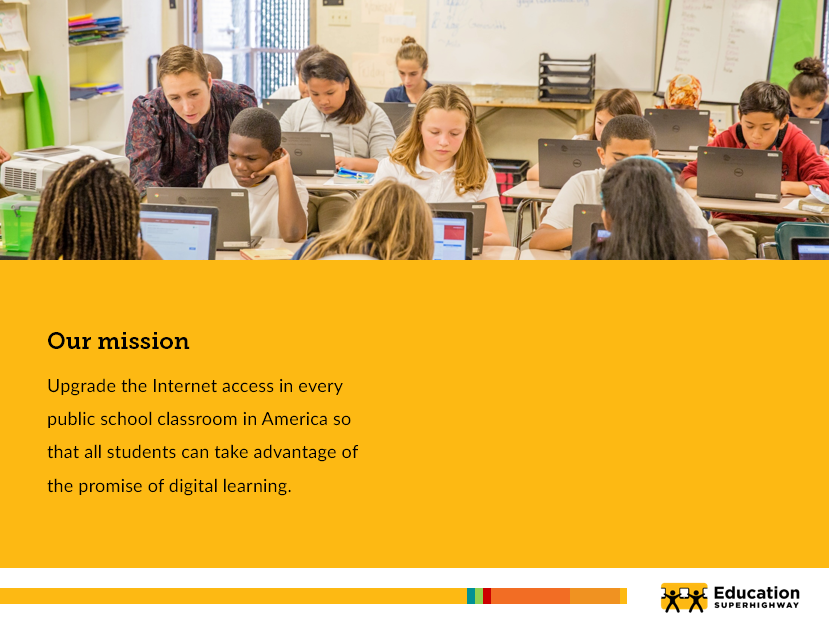
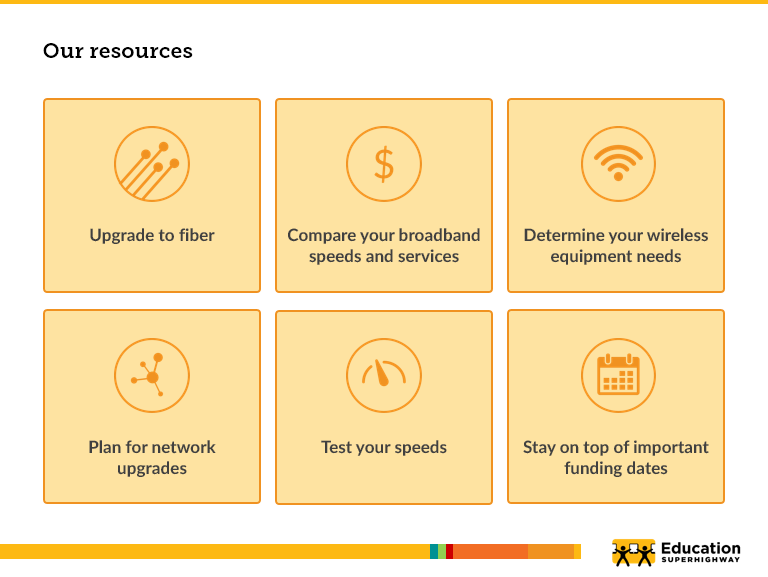
With a mission to connect all classrooms to high-speed broadband, it was important that our organization refocused our messaging, look, and feel to allow for maximum impact when approaching potential clients. I created and refined the visual identity we needed by building the necessary templates and guides to get the entire organization on board.
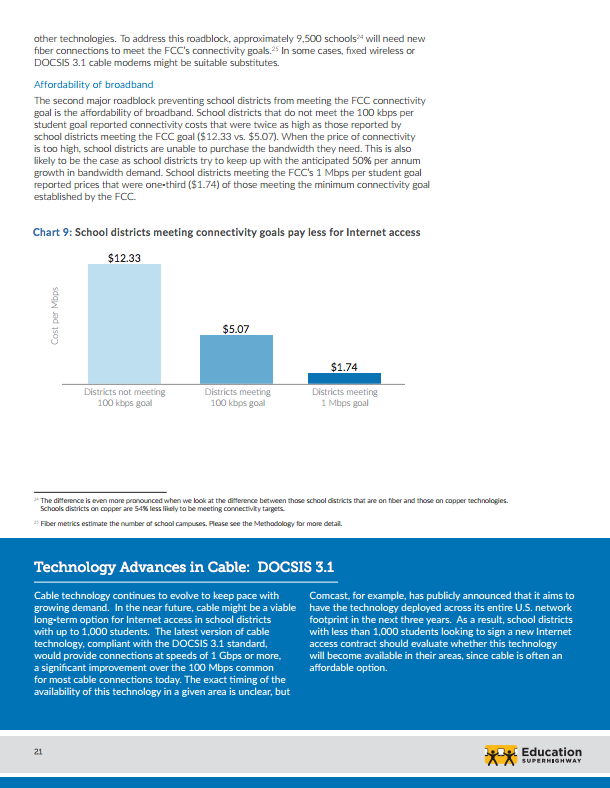
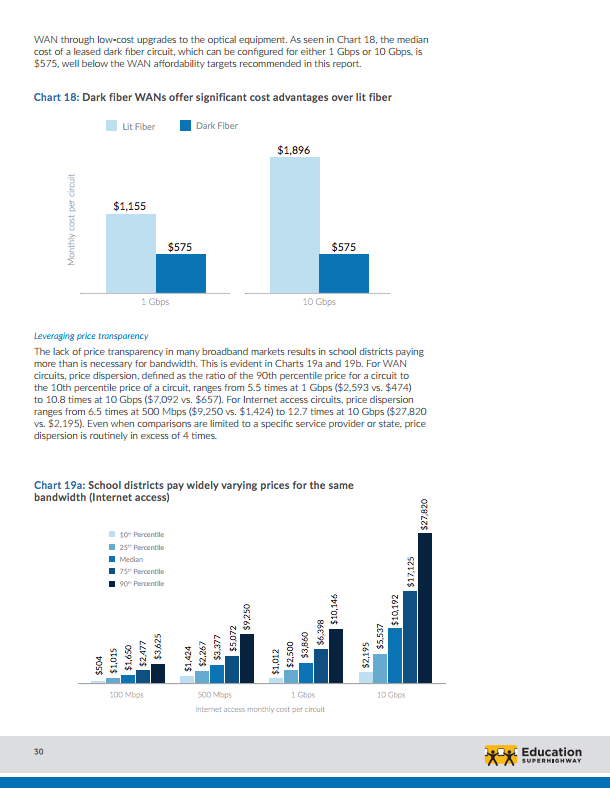
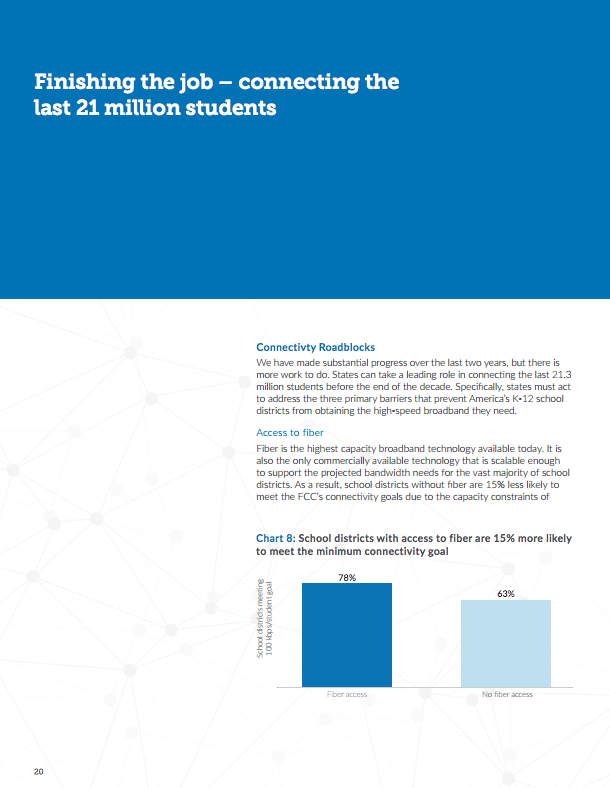
In order to understand the landscape of Internet connectivity in American K-12 public schools, EducationSuperHighway conducted an in-depth analysis of key metrics and presented the findings in a print-ready format. Coordinating multiple freelancers, I was responsible for creating the vision for the report, designing the layout, and ensuring the quality of the final product.
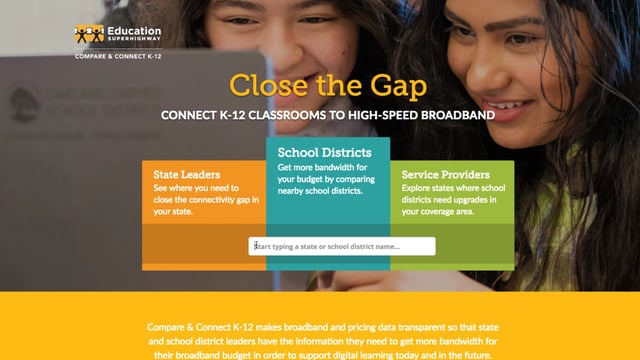
Compare & Connect K-12, an EducationSuperHighway product, displays public E-rate application data, allowing users to explore bandwidth speeds and compare broadband prices with nearby school districts in a specific region or in any state across the country. In line with EducationSuperHighway's marketing strategy for this product, we used this demo to introduce our tool to our customers. I created a supplemental educational video to visualize complex technical data identifying key components of a school network and its relation to the displayed data. This was embedded into the product itself.
I was approached by the organization to overhaul its brand identity to better engage with different external stakeholders. This included creating a style guide, new business cards, creating an overview template, and redesigning their main website.
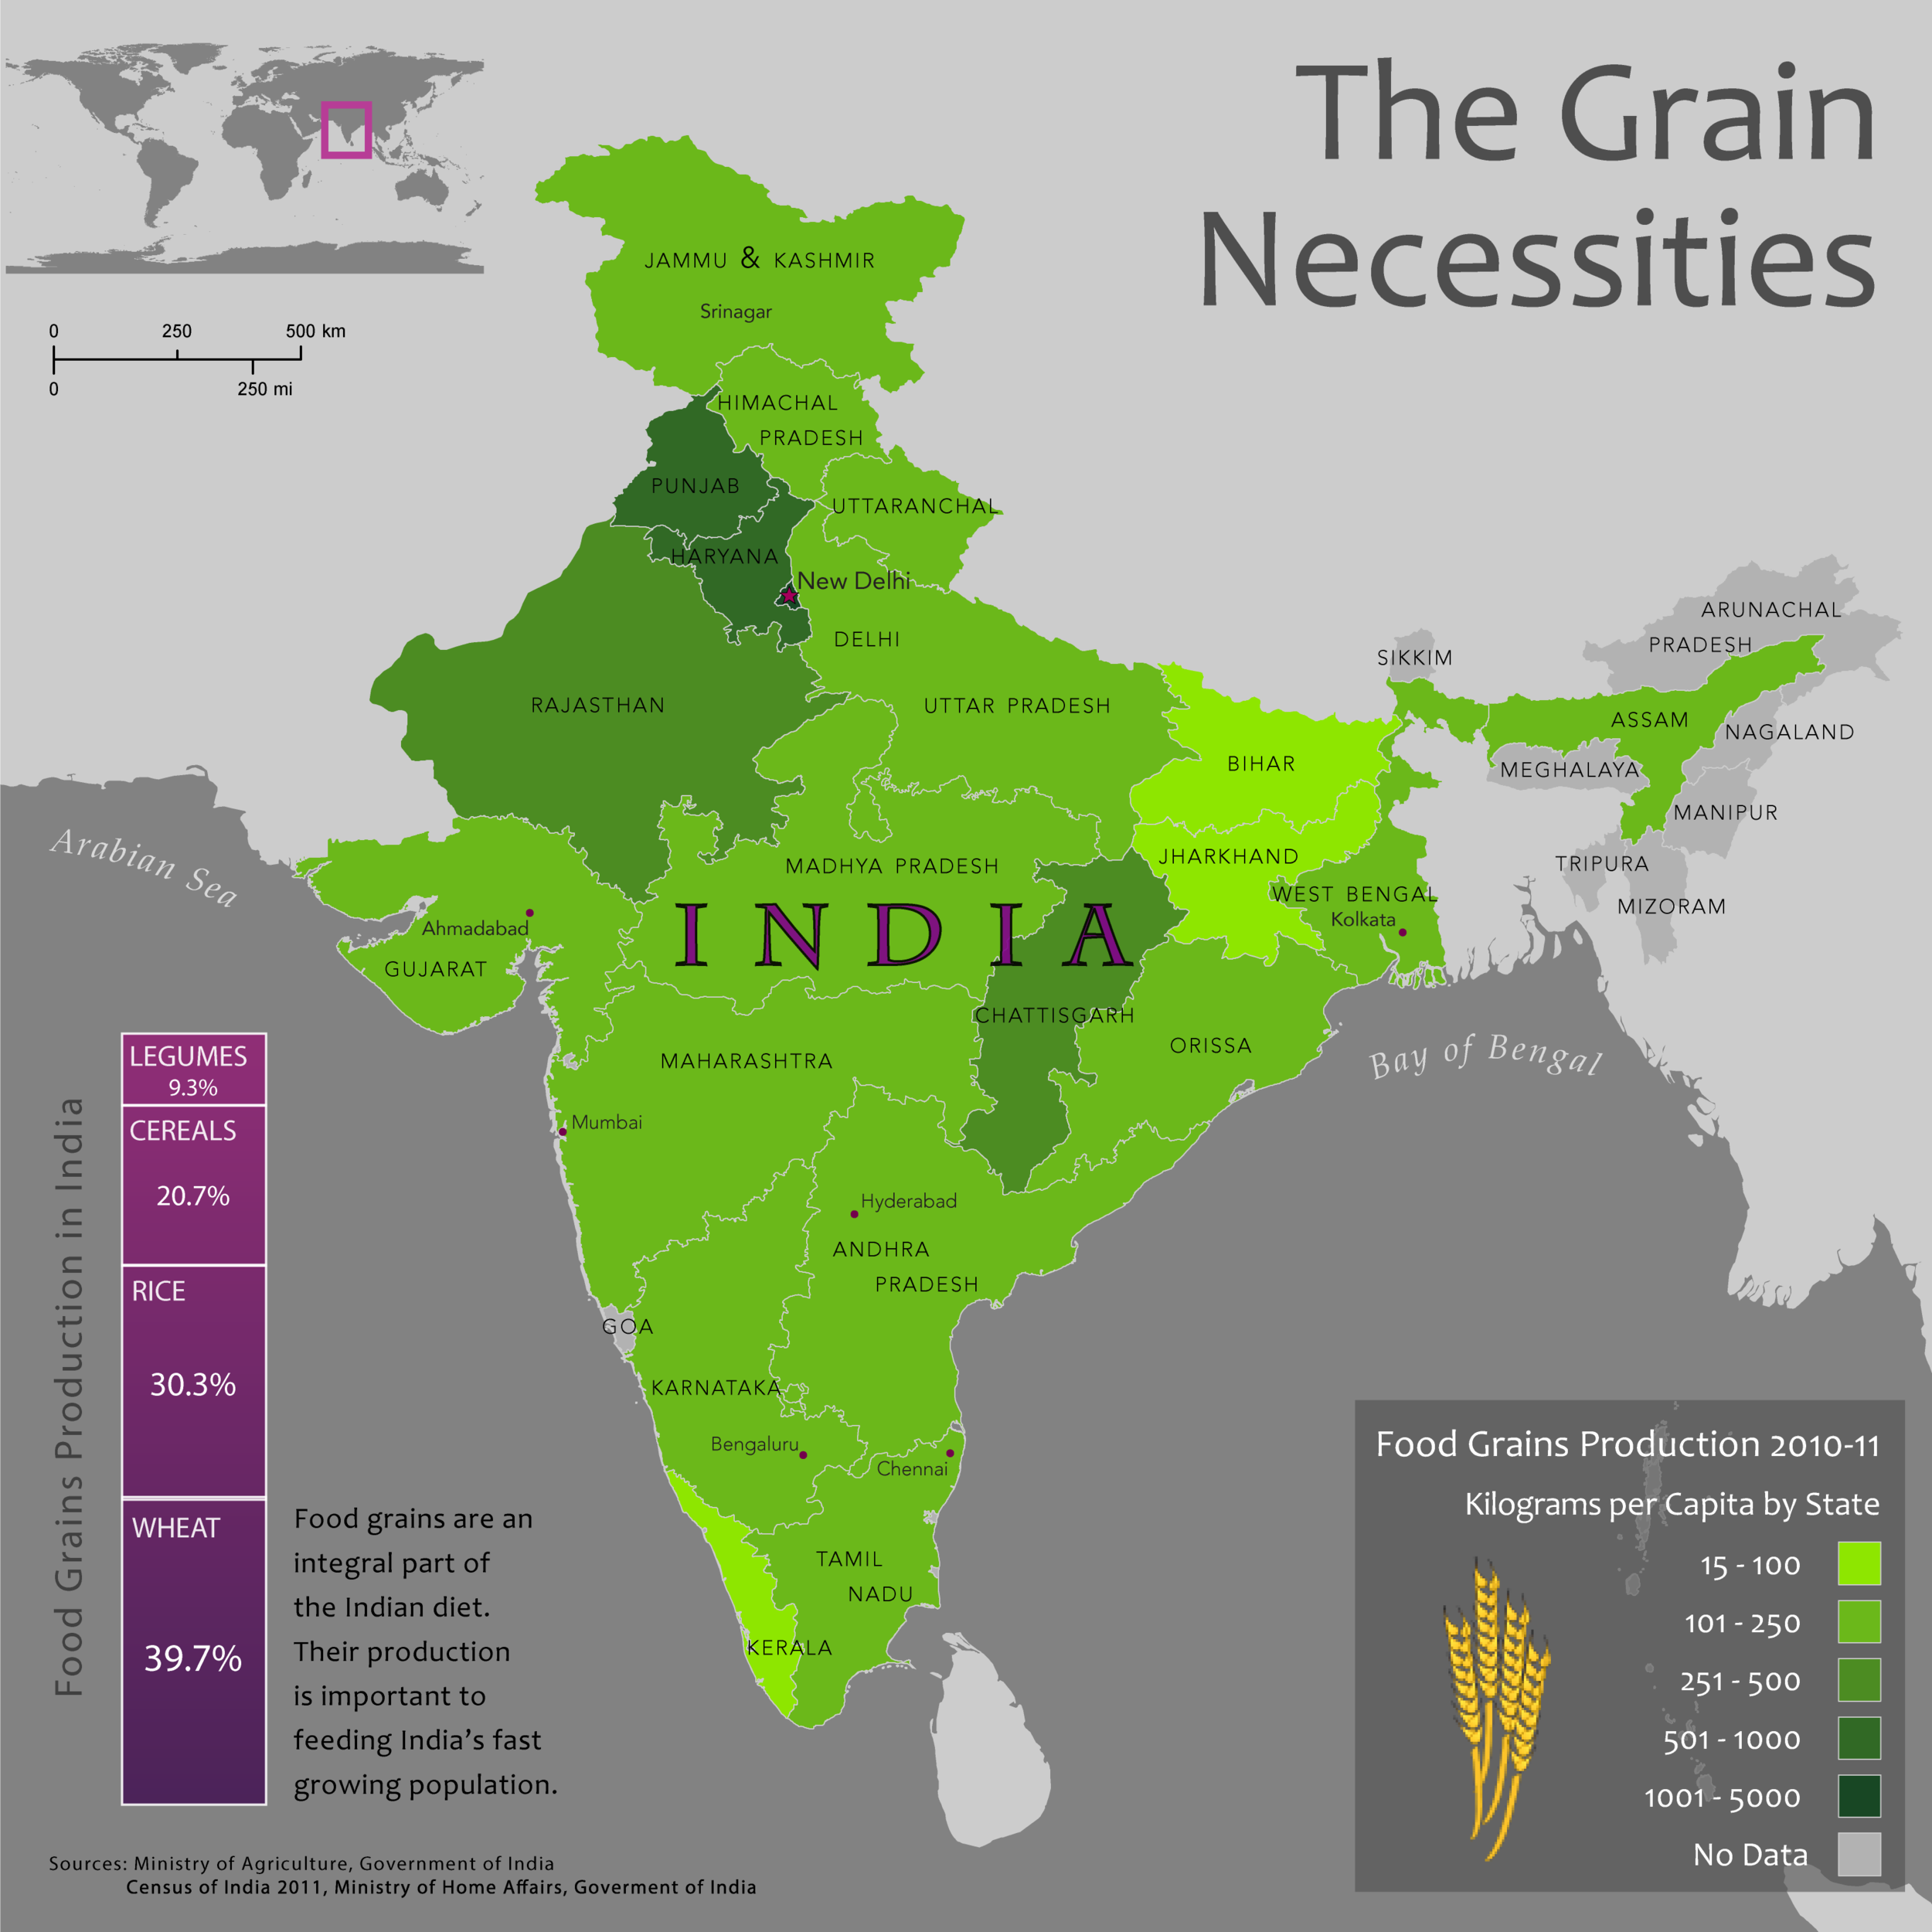
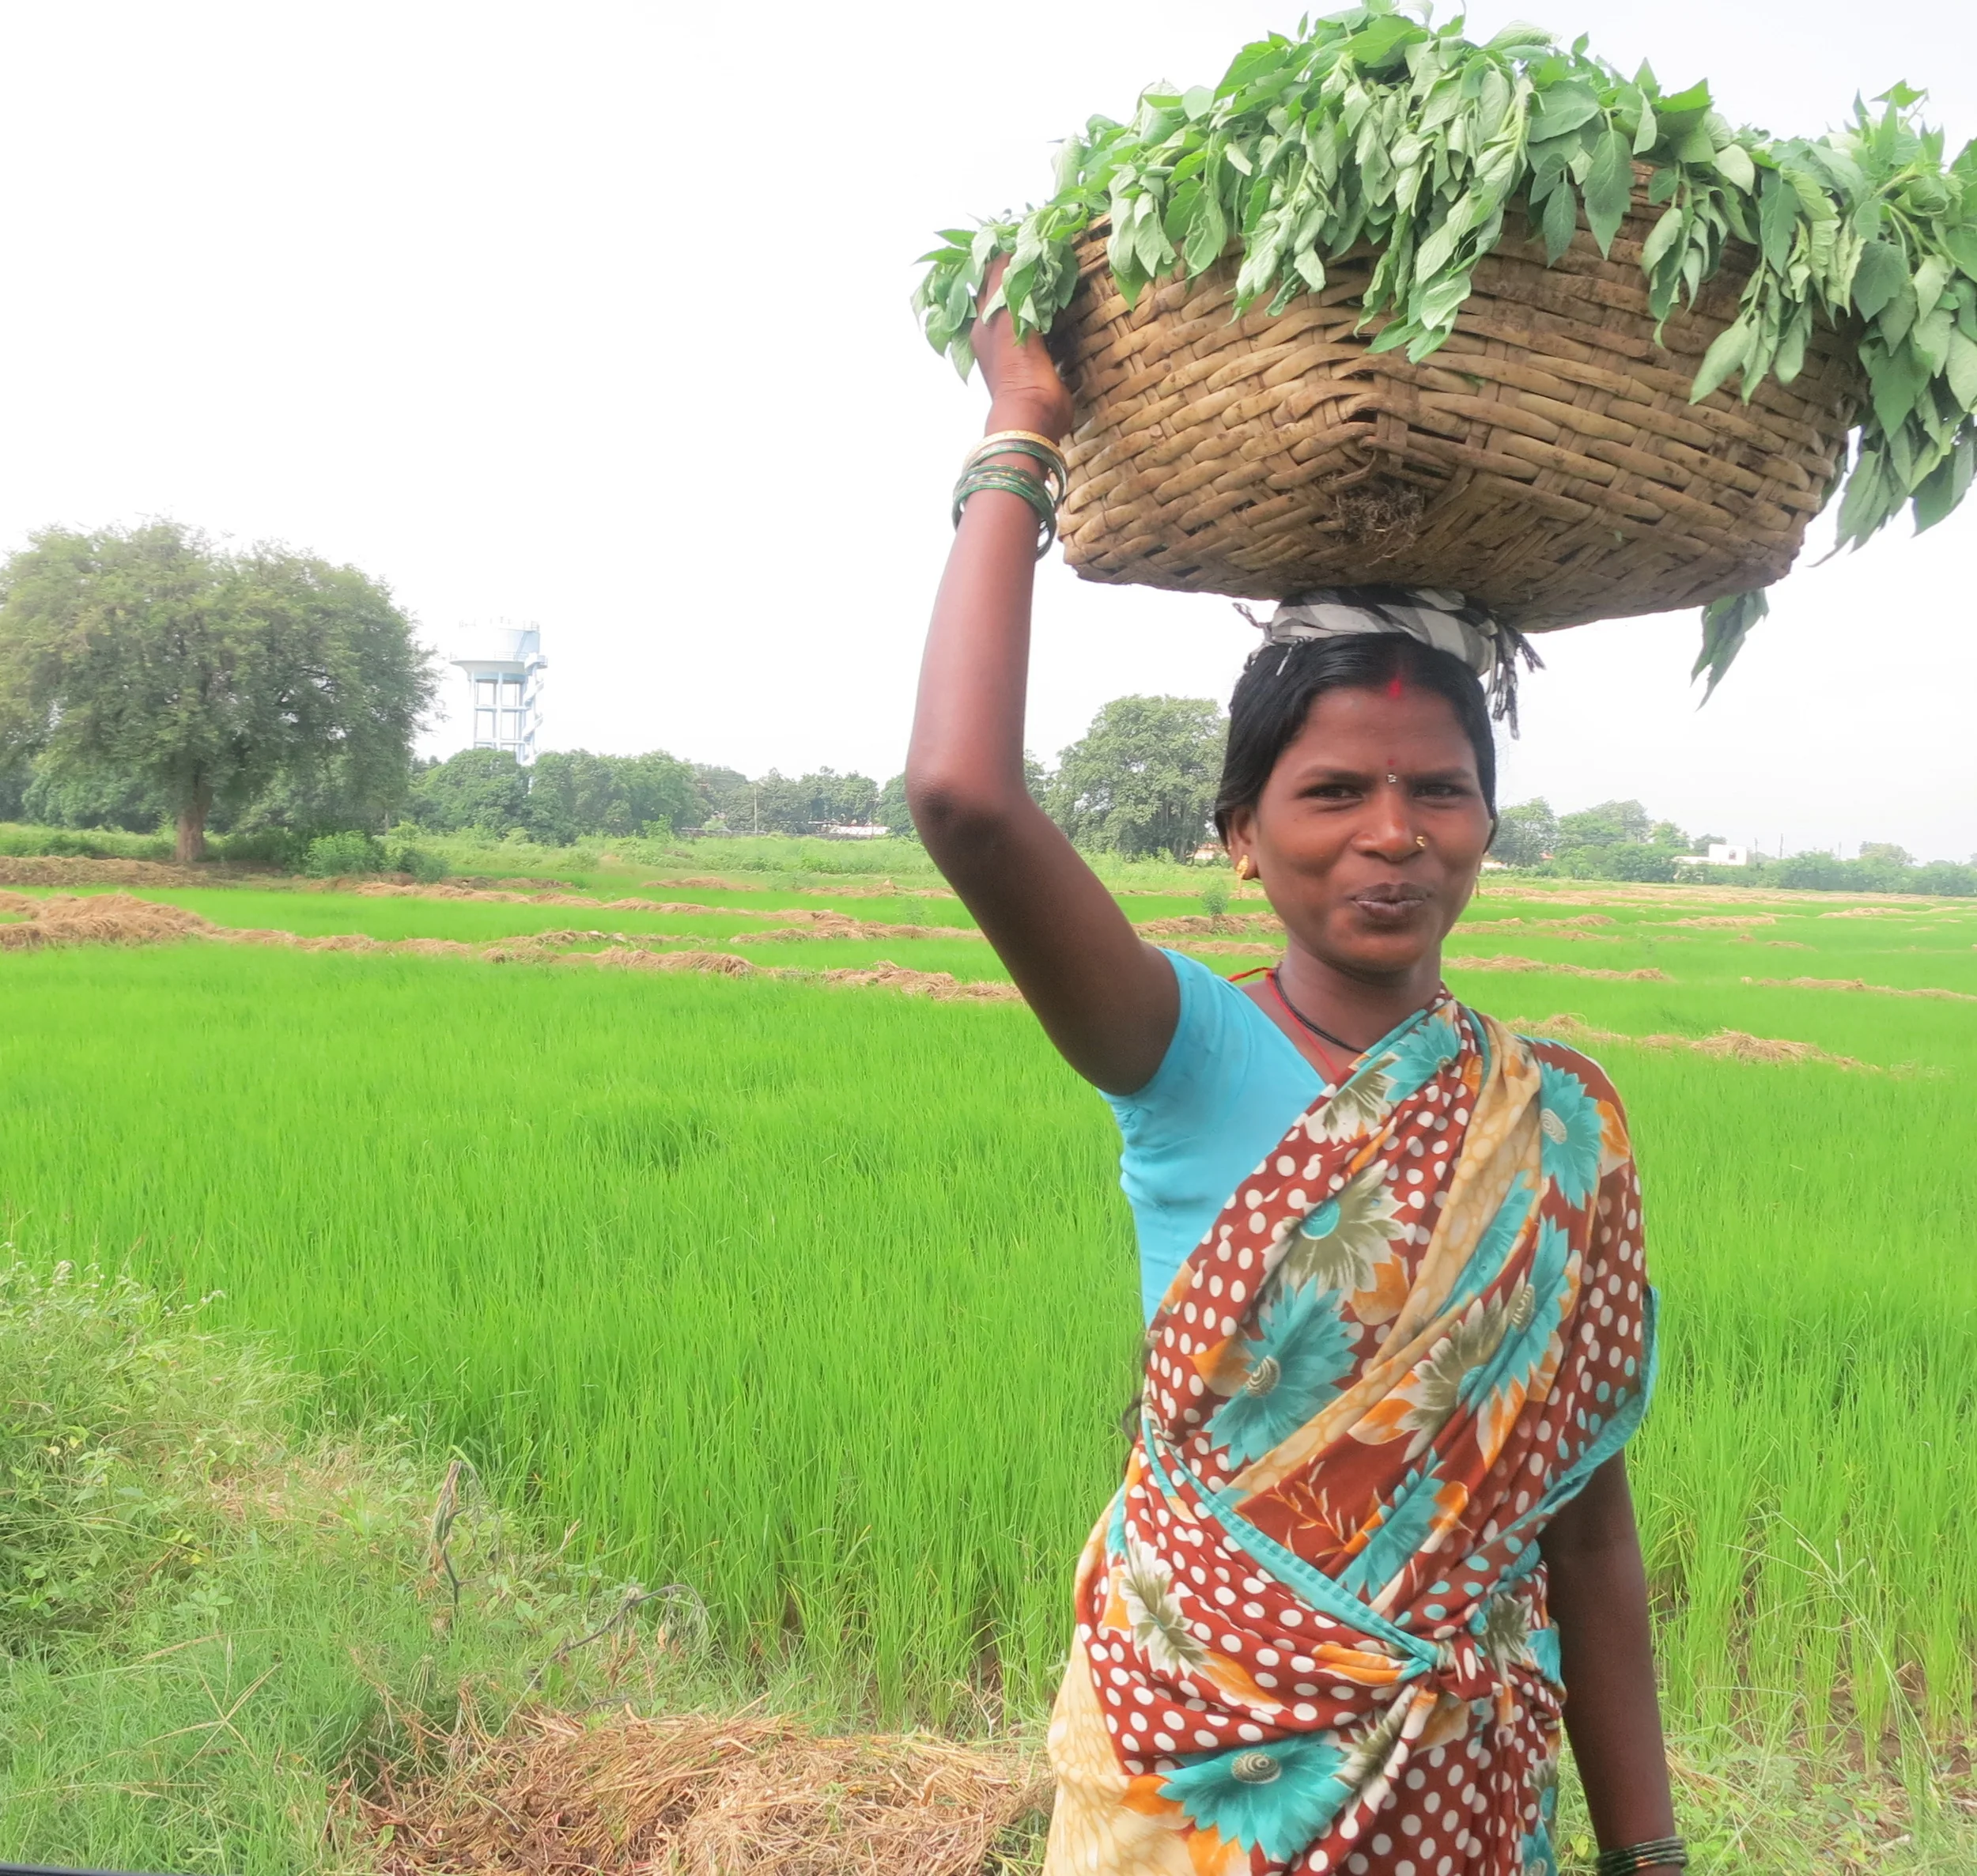
In partnership with Project Rural India Social and Health Improvement, I did a case study on food security in Vadamanappakkam. Specifically, the goal was to understand how different factors affected the agricultural sector with relation to food security. Understanding regional trends in rural agricultural consumption patterns become important when designing specialized government policies and protections for such vulnerable populations. I used different tools including R (statistical programming language, GIS (geographic information systems) and literature reviews to create this case study.
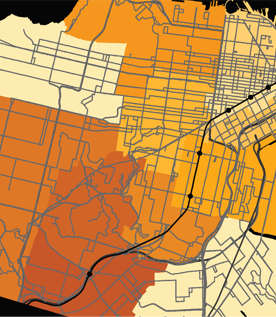
As part of a larger study on greenhouse gas emissions from the transportation sector, I collaborated with Alina Lawrence to visualize the spread of commuters in San Francisco County to help provide policy recommendations for reductions in California’s transportation-related emissions.
As part of promoting general awareness regarding connectivity issues in every state, I created an infographic that would display the most salient data points to provide a high-level understanding for the general public. I have interspersed relevant facts regarding technologies and services as a way of promoting EducationSuperHighway offerings to address the school connectivity issues in any given state.