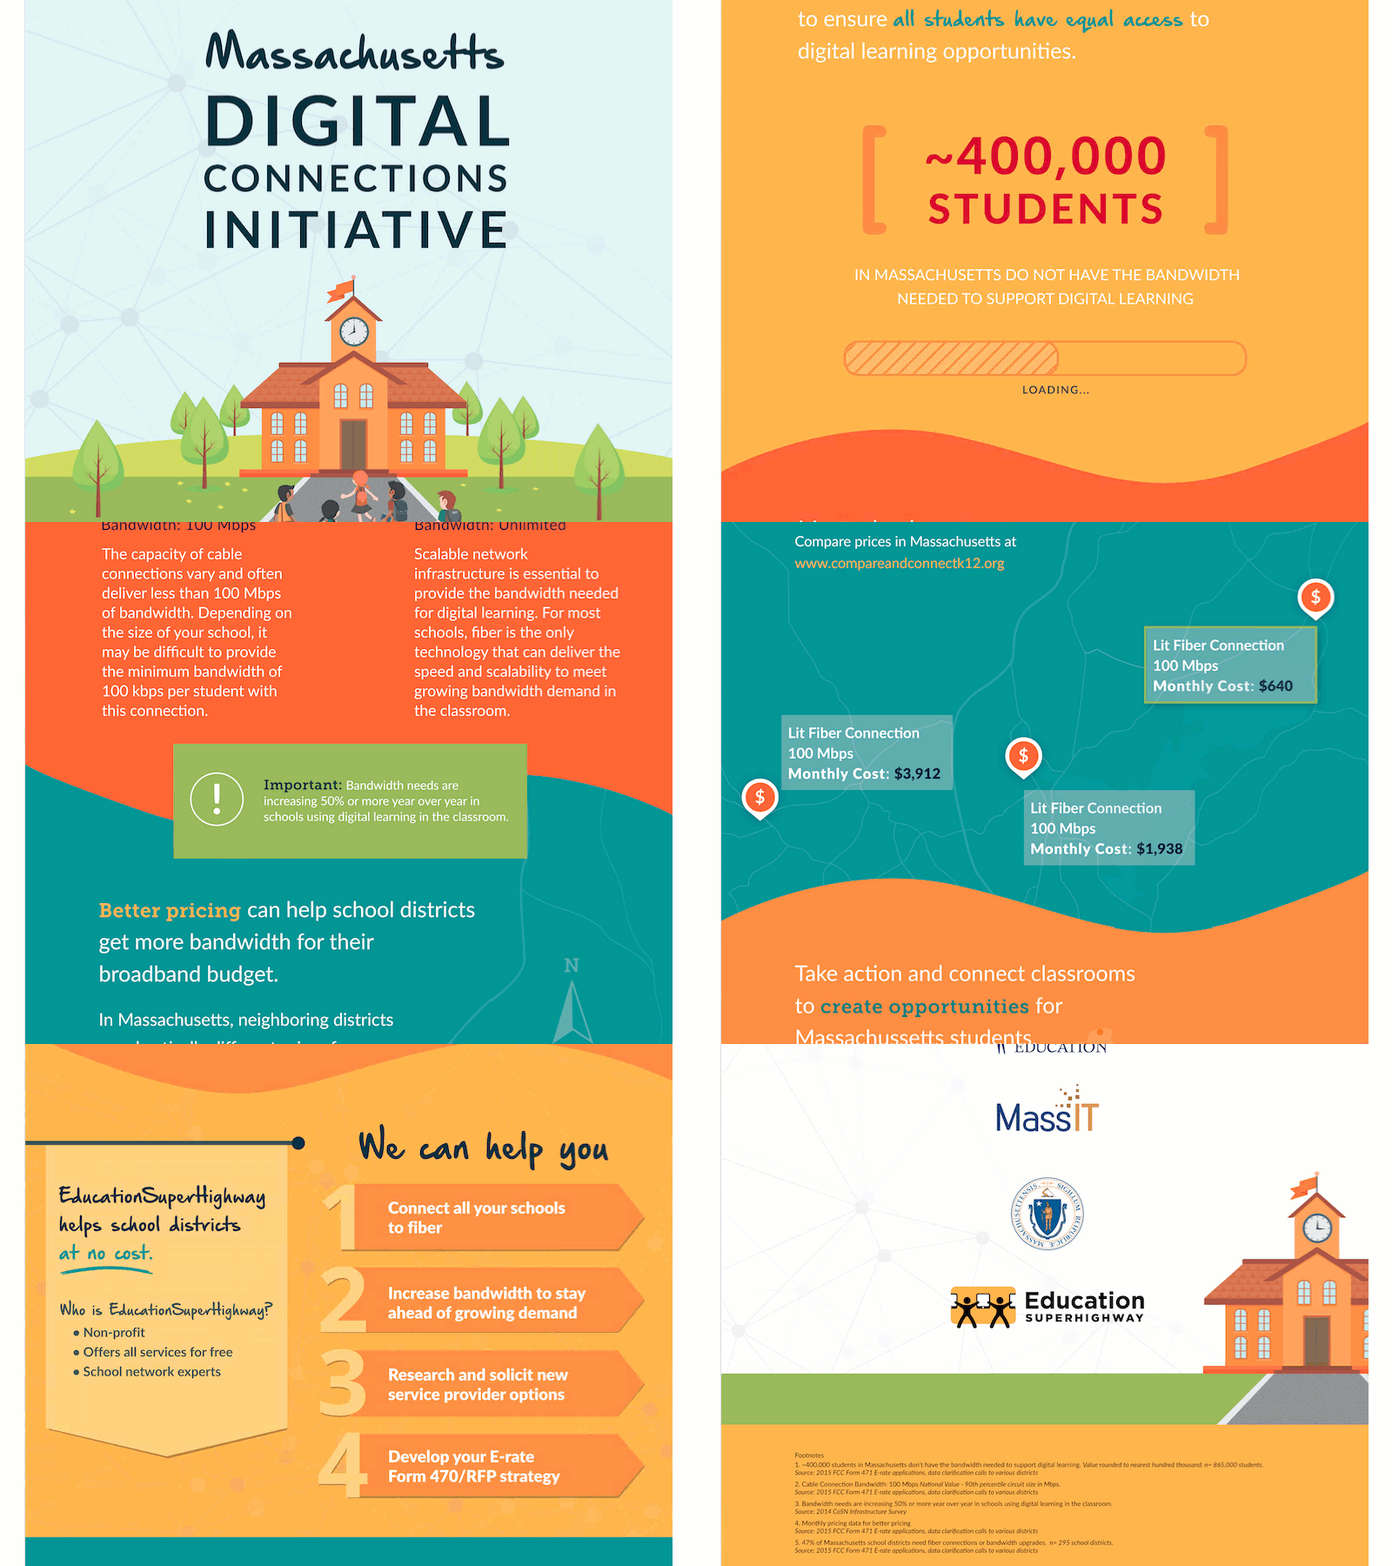
K-12 CONNECTIVITY INFOGRAPHIC
As part of promoting general awareness regarding connectivity issues in every state, I created an infographic that would display the most salient data points to provide a high-level understanding for the general public. I have interspersed relevant facts regarding technologies and services as a way of promoting EducationSuperHighway offerings to address the school connectivity issues in any given state.
Tools used: Adobe Illustrator, QGIS
The HOOK
Creating a sense of urgency was key to this infographic. By choosing "students left behind" as our key metric, it helped shape the remainder of the story that I crafted. I also chose to have a loading bar be the central imagery in this first section since it is ubiquitously associated with Internet connectivity.
the value proposition
As I was creating the story, the call to action was weak without a solid value proposition that everyone could rally around. Getting kids more connectivity was great, but I found that being able to create a value proposition from a financial perspective added the extra push to really complete the story.


